
Lower Lachlan Environmental Flow: The Biggest Yet!
Regulators within the Lake Brewster system were opened to enable the largest use of environmental water in the Lachlan so far to commence on Friday 7 June 2013. The flow comprised licensed water entitlement held by the Commonwealth and State governments, with respective contributions of approximately 75, 000 and 15, 000 megalitres.
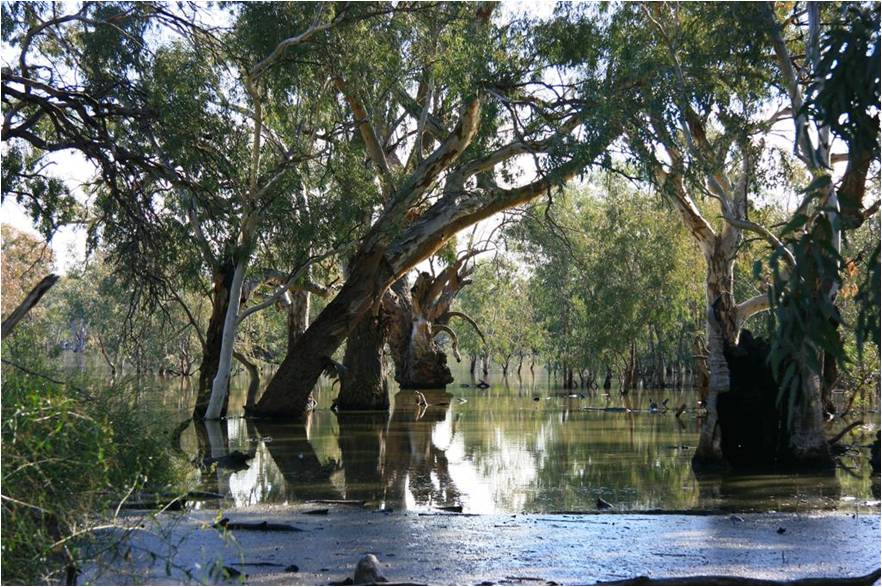
Figure 1 Moon Moon Swamp: environmental flow at approximately peak level, July 2013 (Paul Packard, OEH).
The Lower Lachlan Environmental Flow aims to replenish key wetlands and swamps located south-west of Hillston, including the Lower Lachlan, Great Cumbung, Moon Moon (Figure 1), and Baconian swamps, as well as Lake Ita and Lake Waljeers. Up to 15, 000 hectares of river red gum, black box, lignum and other important wildlife habitat and refuge stand to benefit from the environmental flow.
This environmental flow was developed out of potential watering sites and objectives determined during the Annual Watering Plan process conducted by Office of Environment and Heritage (OEH), and in consultation with the Lachlan Riverine Working Group and Commonwealth Environmental Water Office (CEWO). This follow-up watering of key assets on, and functions and values of the effluent creeks of the lower Lachlan during the cooler months was undertaken to support the critical early stages of vegetation recovery evident at the sites as a result of environmental water delivered in 2011 and past flood events.
The release from the Brewster system is complete and preliminary observations as of 17 July 2013 saw water in most creeks and flood runners on the south-side of the Lower Lachlan Swamp. On the north-side, water has spread out within lower creek channels and flood runners on Little Lake and north of Lake Waljeers (Figure 2).
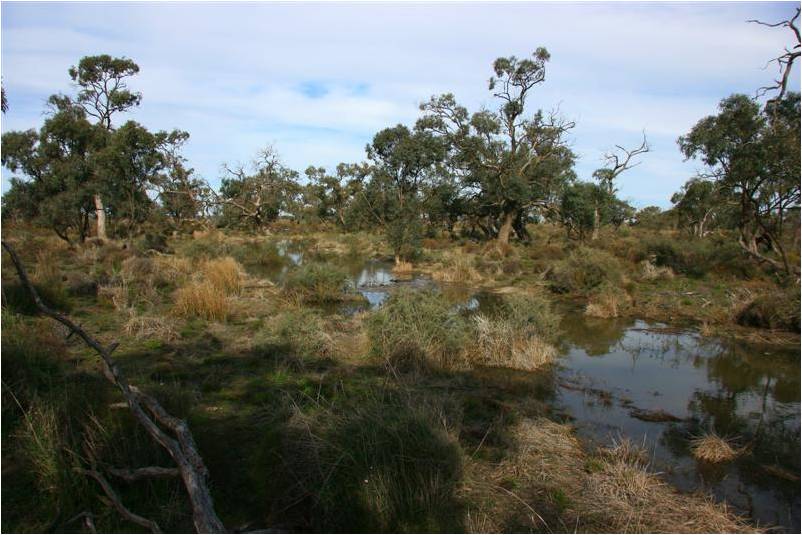
Figure 2 Lower Lachlan Swamp north-west of Lake Waljeers: flows approaching Peppermint Swamp, July 2013 (Paul Packard, OEH).
In the Great Cumbung Swamp, the first signs of rising water were observed in the northern areas of “Toopuntal” around 8 July 2013 (pers. comm., Mick Callanan, ‘Toopuntal’). Approximately 2-days later, water was observed rising and pushing out into fringing channels and swamps at Geramy (Figure 3).

Figure 3 Top of Great Cumbung Swamp at Geramy: first rise July 2013 (Paul Packard, OEH).
Commonwealth Environmental Water Holder (CEWH) and recent former Manager RiverBank at NSW Office of Environment and Heritage (OEH) speak with the LRWG
The Lachlan Riverine Working Group last met in Hillston on 13 June 2013, and were joined by guests David Papps, CEWH, Bruce Campbell, Director, Northern Basin Delivery Section, Commonwealth Environmental Water Office (CEWO), and Graeme Enders, former Manager RiverBank and most recently, OEH Manager South West Regional Operations (Figure 1).
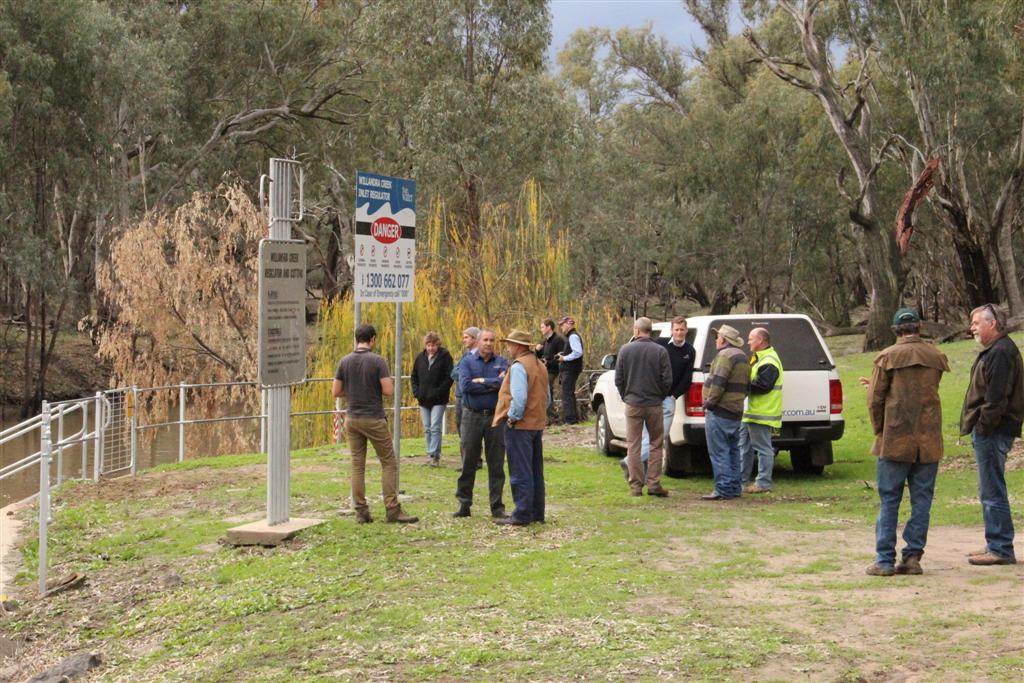
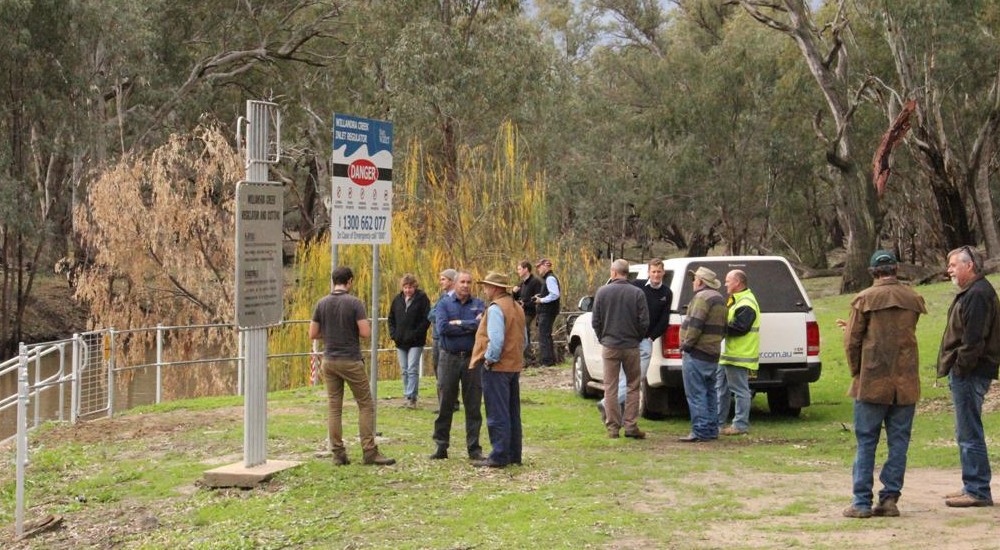
Figure 1 From right to left: LRWG representative, Gordon Turner talks to David Papps (CEWH); SWC Brett Lewis in high vis talks to LRWG representatives Mick Callanan, Fin Martin (LCMA) and Paul Packard (OEH); in the background Sean Kelly (MDBA) and Bruce Campbell (CEWO) look upon and discuss Willandra Regulator; in the foreground Larry Towney (LCMA) and Peter Scanes (OEH) confer; while Graeme Enders and Dr Jan Miller approach Brendan Haine (far left).
The LRWG had informative discussions with David Papps and Bruce Campbell on a number of topical issues including the proposed local/regional-based recruitment process for six Local Engagement Officers across the Murray–Darling Basin (MDB), trading intentions of the CEWO, and fees and charges structures for delivery of environmental water. Graeme Enders outlined OEH’s new regional organisational structure and led the discussion on the potential implications of Local Land Services on the hosting arrangements for the LRWG.
Also joining the LRWG were a team from OEH’s Science Division led by Dr Jan Miller and Peter Scanes, who took this opportunity to consult the LWRG on which wetlands, why and how for the Lachlan Wetland Condition Assessment Project (LWCAP) [link to item at end of newsletter].
The LRWG and guests met the afternoon before at Willandra Weir and Willandra Creek Off-take Regulator (Figure 2), located almost immediately downstream of Lake Brewster with a commence-to-flow for Willandra Creek off-take of 2,400 ML/day. All were able to see ‘environmental water’ from the Lower Lachlan Environmental Flow continue down the Lachlan River arm (*in Figure 2 below), where pelicans (Figure 3) were watching out for opportunistic fish on which to feed. The Willandra Regulator off-take overflow evident in Figure 4 are accounted for as stock and domestic replenishment flow provided along Willandra Creek as far as Willandra Homestead in Willandra National Park. The regulator, and the associated overflow rate, constrains the rate at which flows may be regulated in the Lachlan River downstream.
Lower Lachlan Environmental Flow
Regulators within the Lake Brewster system were opened on 6 June 2013 to enable flows for the Lower Lachlan Environmental watering event to commence in the Lachlan the next day. Further details on the event can be found at http://www.environment.gov.au/ewater/northern/lachlan/lower-lachlan-swamps.html.

Figure 2 Panoramic of Willandra Regulator, and LRWG and guests (13 June 2013).

Figure 3 Pelicans watching and waiting to feed on the back of the Lower Lachlan Environmental Flow released from Lake Brewster.
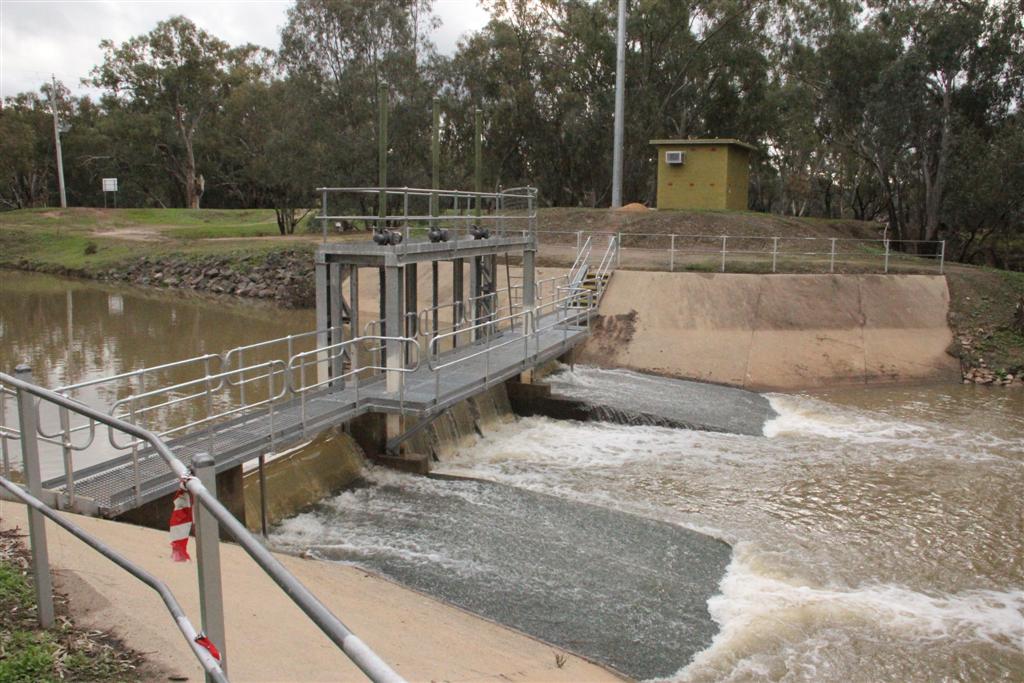
Figure 4 Willandra Creek Regulator or off-take 12 June 2013.
PROJECT UPDATE: Fish on the Move – Lachlan Fish Passage Program
Background
There are nine native fish species that call the Lachlan River home. Many of these fish species migrate short and long distances to spawn, feed and seek shelter. Structures such as dams, weirs, regulators and poorly designed road crossings can create physical barriers that prevent fish movement up and down the river, and stop them from accessing breeding habitat and establishing new territories. A drop of just 10 cm can be a barrier to some species of native fish.
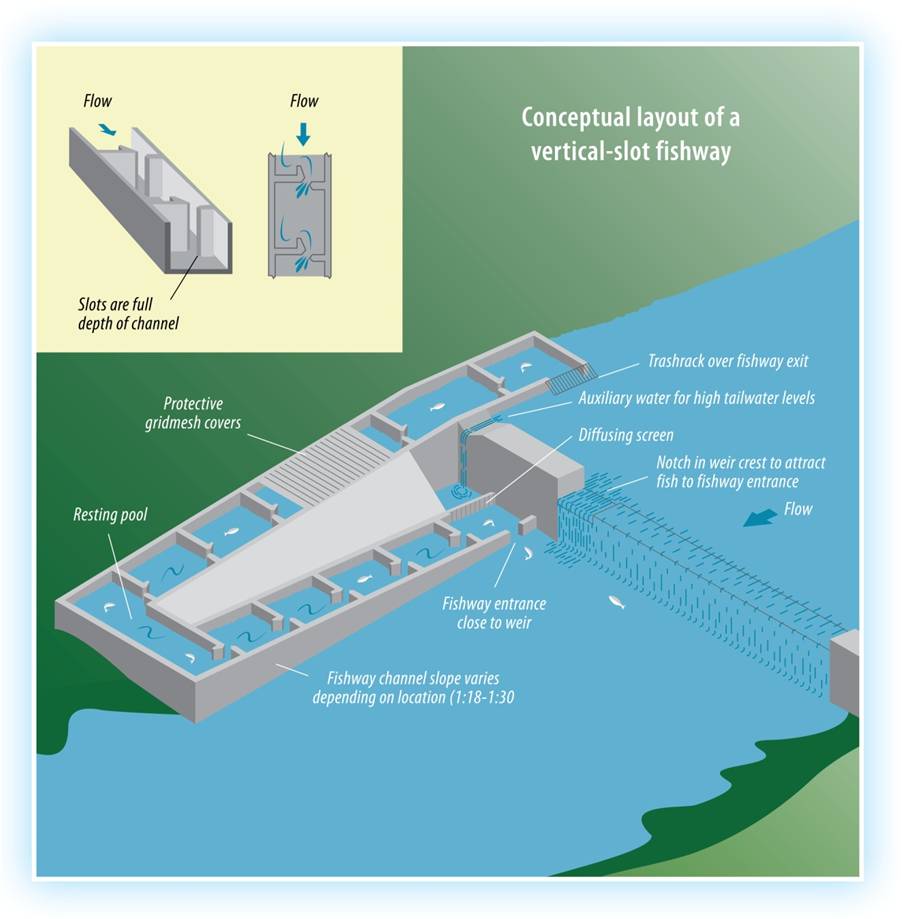
Figure 1 Conceptual design of a vertical-slot fishway (Image: Fisheries NSW).
To ensure the long-term survival of native fish communities in the Lachlan, it is essential that fish can negotiate their way past man-made structures. To date, there have been four fishways constructed by State Water Corporation (SWC) in the Lachlan Catchment: located at Island Creek Weir, Bumbuggan Weir, Lake Cargelligo Weir and Booligal Weir. While fishways come in many forms (e.g. Denil, vertical-slot, lock) and are specifically designed for each location, the vertical slot design in Figure 1 is common in the Lachlan.
Method
In order to assess the effectiveness and functionality of fishways, monitoring utilises Passive Integrated Transponder (PIT) tags inserted into large-bodied fish captured during electrofishing surveys downstream of the weirs (Figure 2). The fish, which are inserted with PIT tags (similar technology to a microchip that is implanted in domestic pet animals), are then released to undertake normal migrations. As PIT-tagged fish enter and exit a fishway fitted with a reader device, they are scanned to identify and archive the species and size of fish that are successfully using the fishway. PIT tags allow researchers to remotely evaluate the effectiveness of fishways in passing target species and size classes, while also providing insights into migrational timing associated with river flows, seasons, and weir operation. Information that can be analysed via PIT tags include the percent of tagged fish that approach the fishway, percent success of fish that enter versus exit the fishway, and the time taken for individual fish to move through the fishway (ascent time).
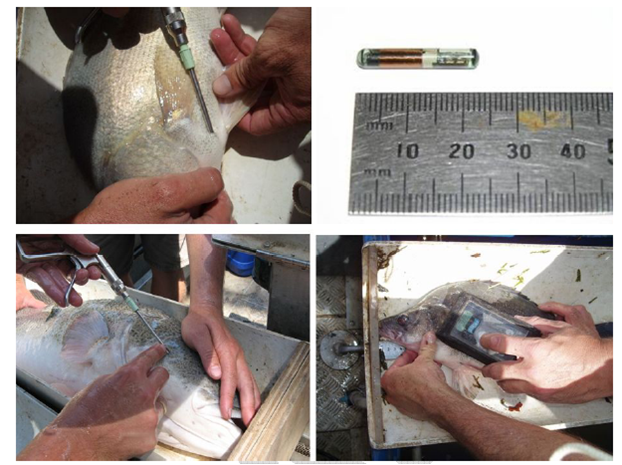
Figure 2 The process of PIT tagging native fish (Image: Fisheries NSW).
Preliminary Results
To date, over 1700 fish have been PIT tagged in the Lachlan River, 85% of which were Carp. Murray Cod make up 9% and Golden Perch 5%, with the remaining 1% being Eel-tailed Catfish and Silver Perch.
Unsurprisingly, preliminary data from Island Creek and Bumbuggan fishways indicate that Carp are fearless, strong swimmers and quick learners, with the majority of them zooming through the fishways and successfully exiting upstream. Typically, they were recorded as approaching the entry point of the fishway a couple of times before actually entering. The ascent time, which is the time taken for a fish to move all the way through the fishway, varied between the different fishways. However, Carp outperformed every other species in terms of getting up the courage to enter and the speed in which they were able to negotiate the fishway, which for the most part was less than few hours.
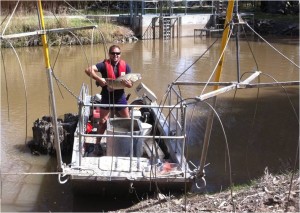
Figure 3 Fisheries NSW technician, Nathan Reynoldson holding a Murray Cod in the electrofishing punt, after collecting PIT data and tagging fish at Island Creek fishway (Image: Fisheries NSW).
On the other hand, Murray Cod and other native species were recorded as typically approaching a fishway anywhere from four to nine times before entering, in timeframes ranging from just over 1 hour to 4 days or more. Ascent time also varied greatly between sites and species, taking anywhere between 1 and 25 hours for them to successfully move through the fishways. With the installation of a new PIT tag reader at Booligal and the repair of the reader at Lake Cargelligo (which was flooded and offline), more data is set to flow in to give us all an insight into the secret life of fish.
ENVIRONMENTAL WATERING: Commencing E-Flow Event Alert Coming Soon
The Lachlan Environmental Water Management Plan (LEWMP) is the only ‘live or dynamic’ web-based plan of its kind in NSW and is currently undergoing a review and exciting re-design!
New features will include an Interactive Google Map and ‘Commencing Events’, designed to inform the public about relatively high Lachlan River levels outside of the usual irrigation order time period in preparation for a potential environmental watering event.
For example, there were numerous inquiries recently about why the Lachlan River ran high from late April as State Water Corporation (SWC) began releasing water from Wyangala Dam to build up enough volume in Lake Brewster to enable 3,000 ML/day below Lake Brewster (before kicking off the current Lower Lachlan Environmental Flow 7 June 2013). It is hoped that once the new ‘Commencing Events’ and ‘What’s New’ sections are ‘live’ on the re-designed LEWMP homepage by the end of August 2013, the sections will become a useful point of reference for interested parties. So watch this space www.lewag.com.au!
The Regional Wellbeing Survey: an MDBfutures initiative
The wellbeing of rural and regional communities is the focus of a large-scale survey being conducted during July and August 2013, with people living throughout the Murray-Darling Basin, and in other areas of regional Australia, invited to take part. The survey is part of a multi-year study aimed at tracking community wellbeing over time, and will be considered by the Murray-Darling Basin Authority (Authority) in the monitoring and evaluation of the Basin Plan.
In designing the survey, the University of Canberra research team is working with survey partners such as Authority, the National Farmers Federation, National Irrigators Council, and the Department of Sustainability, Environment, Water, Population and Communities (DSEWPaC).
What will this survey provide that is useful to my community or the group I represent?
Interested communities or groups (with 100+ responses) will have access to the survey results, ensuring that the study provides data that can be used by communities/groups to help understand how their wellbeing is changing, and how that compares to the average for other communities/groups.If you’d like to be able to access results for your community or group, and/or promote the survey in that community/group please get in contact with Edwina.Loxton@canberra.edu.au or 0412 620 894. Read more at http://www.vision6.com.au/em/mail/view.php?id=1002522&a=39237&k=7b05547#Wellbeing.
Request for Tender in relation to the Commonwealth Environmental Water Office Long-Term Intervention Monitoring Project
The Request for Tender in Relation to the Commonwealth Environmental Water Office Long-Term Intervention Monitoring Project was released 3 July 2013. The closing time is 2pm, 28 August 2013 (Canberra time). Details are at the AusTender website: https://www.tenders.gov.au/?event=public.atm.show&ATMUUID=A2AC199B-BBF7-4C91-6FBDC9C65C5C8D60